WTAI6: WolfTicketsAI's Most Profitable Model Yet
Table of Contents

TL;DR
After a lot of trial and error, I created a brand new model for WolfTicketsAI.
It’ll take me a few weeks to get it fully integrated into the site.
The bets for this week from the model are:
1Sergei Pavlovich (-235) + Michel Pereira (-295)2
3- **Combined Expected Value**: +0.077 (7.7% edge)4- **Estimated Win Probability**: 58.2%5- **Parlay Odds**: -1106- **$100 Bet Returns**: $190.88
What Have I Been Up To?
This has been a very busy year for my day job. I was Head of Product for Protect AI, a company building a cybersecurity platform for operating AI workloads. We were acquired by Palo Alto Networks . The acquisition took a huge amount of my time, and until the ink was dry I was not able to write about it. The short version is that we’re able to now focus on building the same great tech but at a much larger scale.
In the last year I’ve thrown out over 23 different experiments to build a better model. Every time it all ended in tears, with a model that simply did not perform any better. Finally, I decided to make my life a bit simpler and create a new codebase from scratch. There I could do experiments without having to worry about damaging the production work of WolfTicketsAI. This allowed me to really get into the meat of some new features, grounding them in the trends that happen round by round for fighters, not simply the stats at the end of a fight.
The work has paid off and I’m excited to introduce WTAI6 - the sixth generation of our WolfTickets.AI prediction model. This isn’t just an incremental improvement; it represents a fundamental breakthrough in how I approach feature engineering and modeling, while building on our betting strategy.
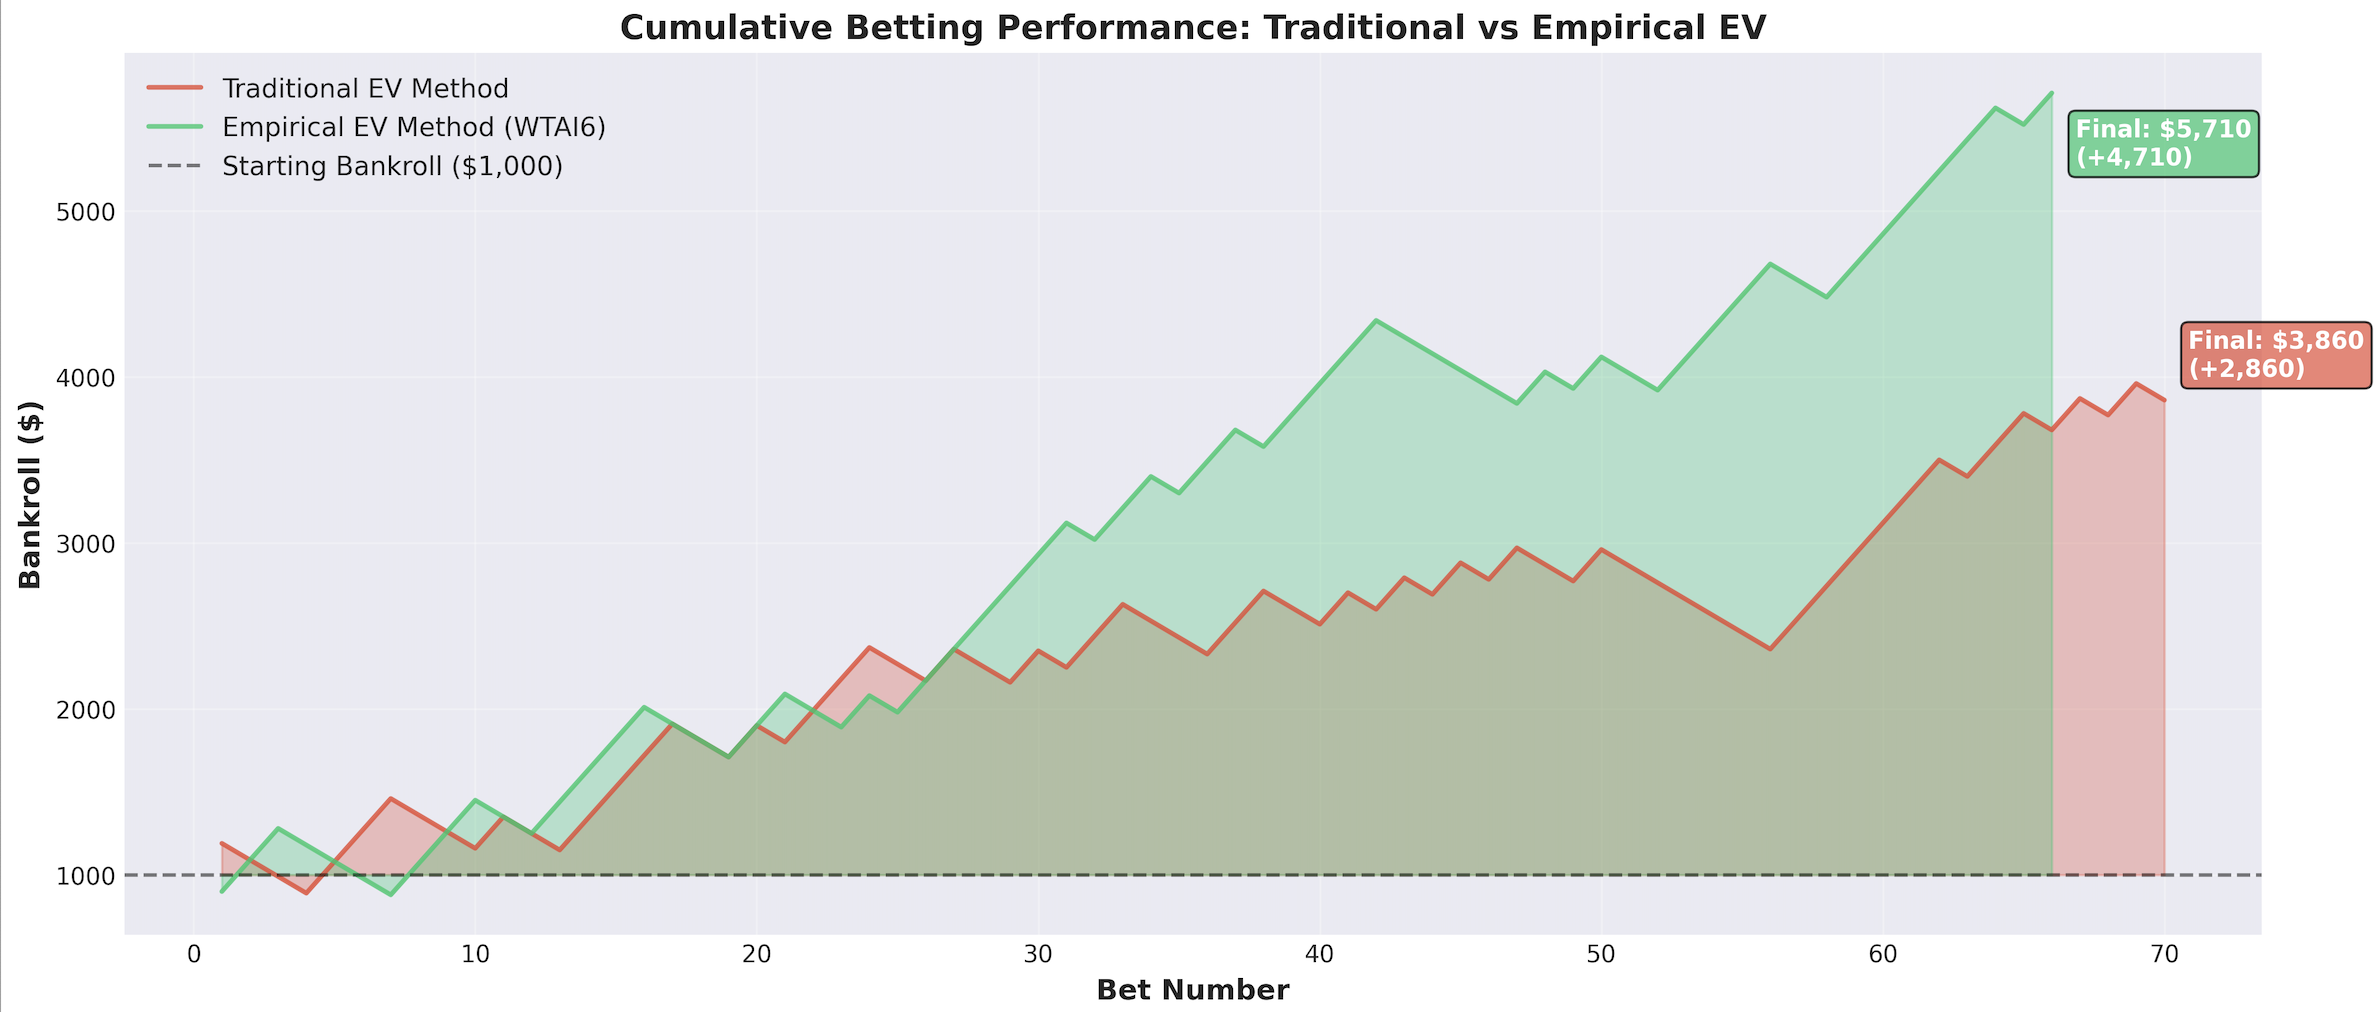
WTAI6 delivered 212% ROI compared to our previous approach’s 151% - a massive 61 percentage point improvement in profitability while maintaining our disciplined 2-leg parlay strategy.
WTAI6 Under the Hood
There’s not a single feature that’s consistently preserved from the previous work on WolfTicketsAI. The metrics for this model for 2024/5 as a validation period are:
1Accuracy:           68.3%2Baseline:           54.6% (majority class)3Improvement:        +13.7 percentage points4
5Precision:          68.9%6Recall:             76.2%7F1-Score:           72.4%8Specificity:        58.6%9
10ROC-AUC:            75.4% (excellent discriminative ability)11Log Loss:           0.590 (reasonable calibration)
WTAI6 maintains the foundation of an ensemble 1 1 The Ensemble approach combines multiple base learners (Random Forest, XGBoost, LightGBM, Neural Networks) with stacking. while adding significant feature engineering improvements:
Enhanced Feature Set (75+ Features)
- Temporal Features: Recent performance windows with decay functions
- Style Matchup Analysis: Comprehensive striker vs grappler modeling
- Physical Advantage Quantification: Height, reach, and age differential impacts
- Market Intelligence: Betting odds integration with implied probability analysis
- Round-by-Round Statistics: Leveraging our comprehensive round-level data collection
This distilled my insights on MMA along with the traditional stats to create a more comprehensive view on fighters.
Weight Class Specialization
Just like every model before it, there’s a bias in how we handle various weight classes. Making a truly balanced model for all weight classes will stay a pipe dream for now:
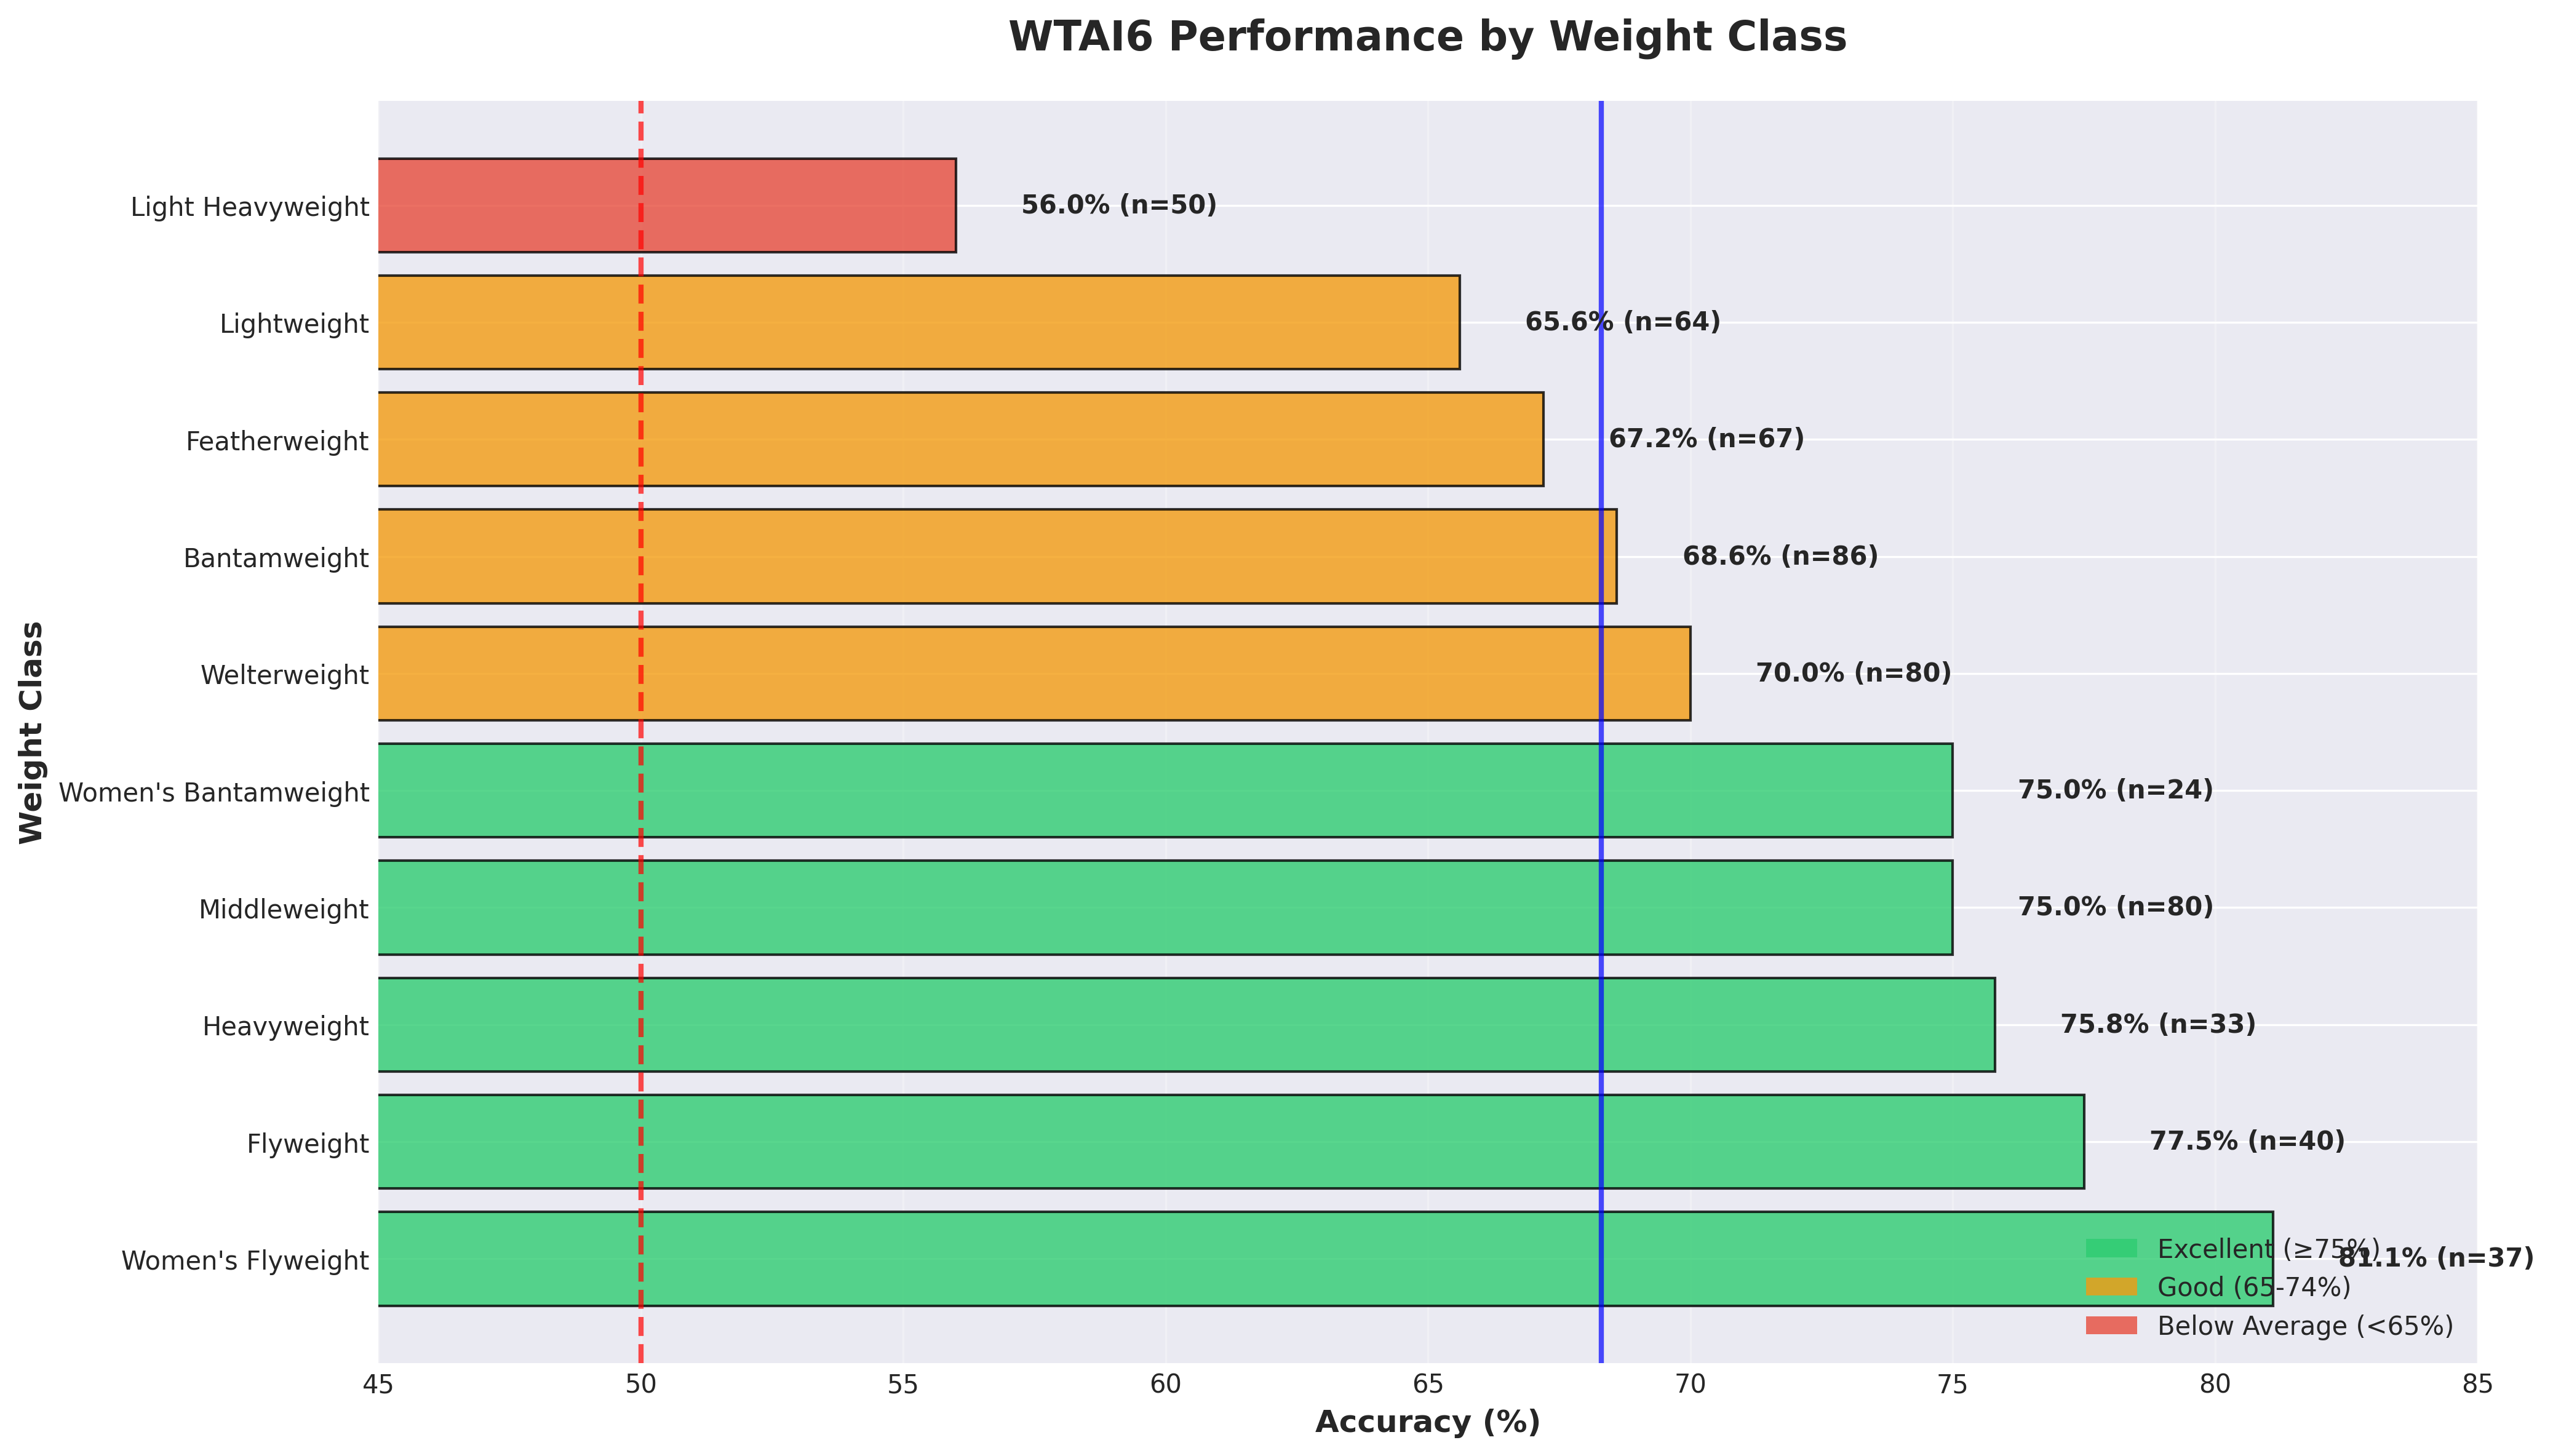
| Division | Accuracy | Performance Tier |
|---|---|---|
| Women’s Flyweight | 81.1% | ⭐ Excellent |
| Flyweight | 77.5% | ⭐ Excellent |
| Heavyweight | 75.8% | ⭐ Very Good |
| Middleweight | 75.0% | ⭐ Very Good |
| Light Heavyweight | 56.0% | ⚠️ Below Average |
This division-specific insight informs our betting strategy - we’re more aggressive on women’s divisions and extreme weight classes where our edge is strongest. This comes out in the specific way that the calibrated EV is used to weight a choice for an event. 2 2 This is really just proof that Light Heavyweight is the worst possible weight class. Take that as you wish.
The Problem with Traditional Confidence Scores
Our previous models (WTAI1-5) used what I’ll call “arbitrary confidence mapping” 3 3 Traditional confidence mapping typically uses a linear or simple polynomial relationship between raw model scores and assigned confidence percentages, without validation against historical performance. This approach assumes the model’s internal confidence scoring aligns with real-world accuracy, which is rarely the case in practice. - we’d assign confidence percentages based on model output scores without truly understanding what those scores meant in real-world terms. A model confidence score of 20 might map to 79% win probability, but this was essentially educated guesswork.
The results? While I achieved solid performance, we all were leaving money on the table because our Expected Value calculations weren’t grounded in empirical reality.
Rebuilding Expected Value
WTAI6 introduces empirical Expected Value 4 4 Empirical Expected Value differs from theoretical EV by using actual historical model performance to calibrate probabilities rather than relying on the model’s raw confidence scores. This approach ensures that when we assign a 75% win probability, fighters actually win approximately 75% of the time historically. - a methodology that uses the model’s actual historical performance to calibrate probabilities rather than relying on arbitrary confidence mappings.
Here’s how it works:
Step 1: Model Calibration Analysis
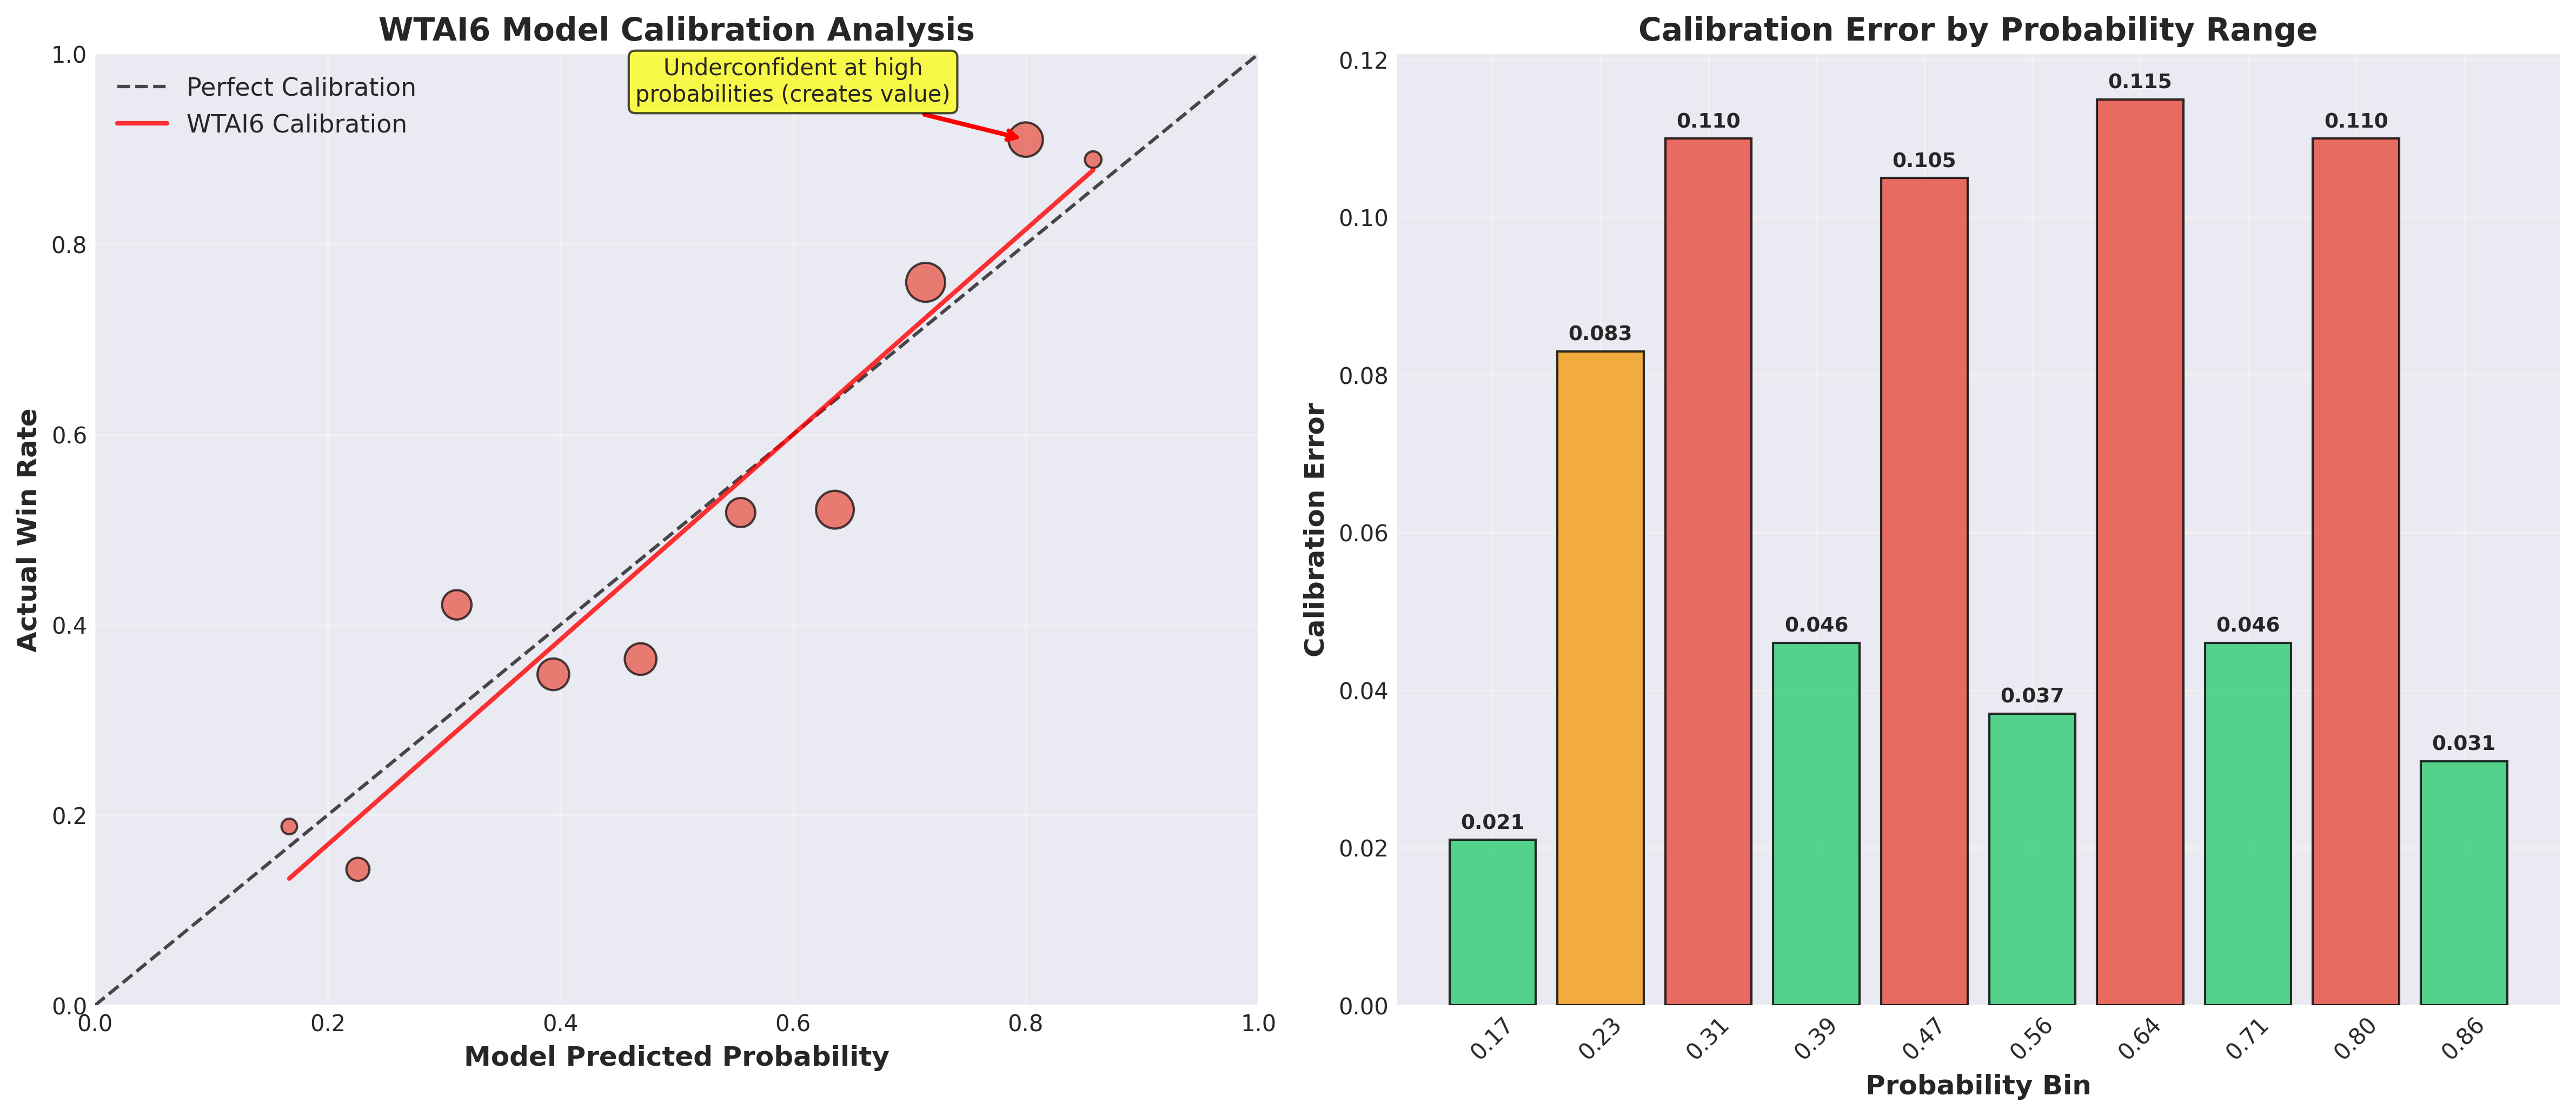
I analyzed 586 UFC fights from January 2024 to August 2025, mapping our model’s predicted probabilities against actual fight outcomes. What I discovered was incredibly vindicating:
- High-confidence predictions were systematically underconfident: When the model predicted 80% win probability, fighters actually won 91% of the time
- Mid-range predictions showed overconfidence: 64% model predictions corresponded to 52% actual win rates
- The pattern was consistent and exploitable
Step 2: Calibration Function Creation
Using scipy interpolation 5 5 The scipy.interpolate module provides robust interpolation methods for creating smooth calibration functions. We use monotonic cubic spline interpolation to ensure the calibration function maintains logical probability ordering while smoothing over noise in smaller probability bins. , I created a calibration function that maps raw model probabilities to empirically-validated win rates. This removes the arbitrary binning of probabilities I provided in the previous versions and grounds them in over a year of performance data.
Step 3: Empirical EV Calculation
Instead of EV = Confidence Score - Market Probability, I now use:
1EV = Calibrated Probability - Market Implied ProbabilityWhere the calibrated probability reflects actual historical performance patterns. Nothing crazy here, this is a cleaner method.
Step 4: Model Calibration:
The breakthrough in WTAI6 comes from understanding exactly how our model performs across different probability ranges. The calibration analysis revealed that our model is systematically underconfident at high probabilities 6 6 Model underconfidence at high probability ranges is common in machine learning applications where base rates are considered. The model correctly identifies strong signals but doesn’t account for the compounding effect of multiple positive indicators, leading to systematically conservative probability estimates. - when it predicts 80% win probability, fighters actually win 91% of the time. This creates exploitable value in the betting markets.
Confidence Tier Performance
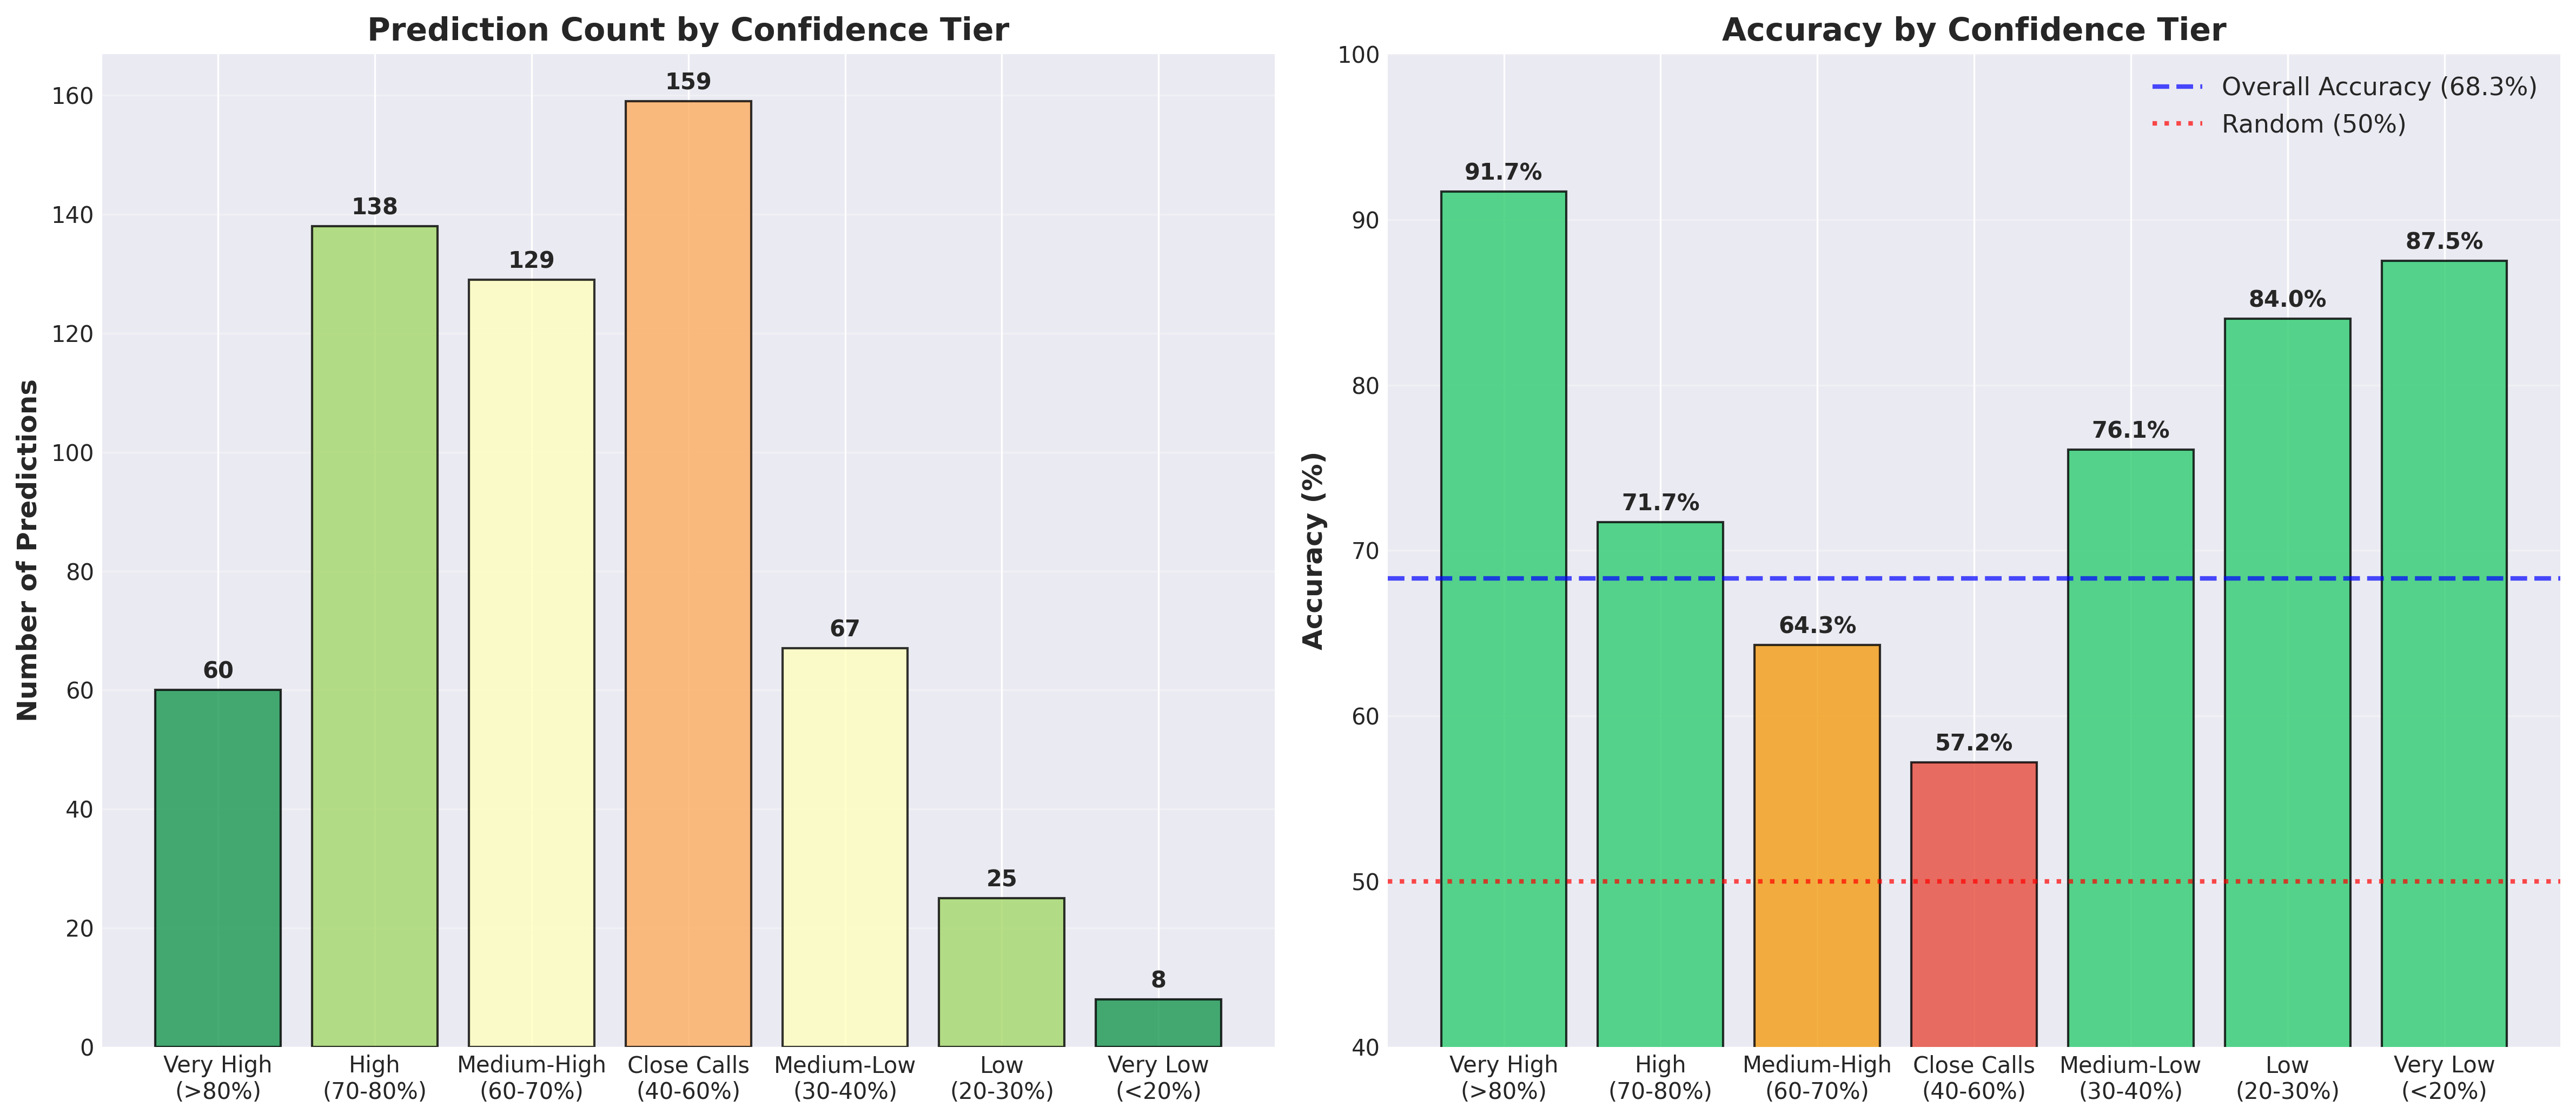
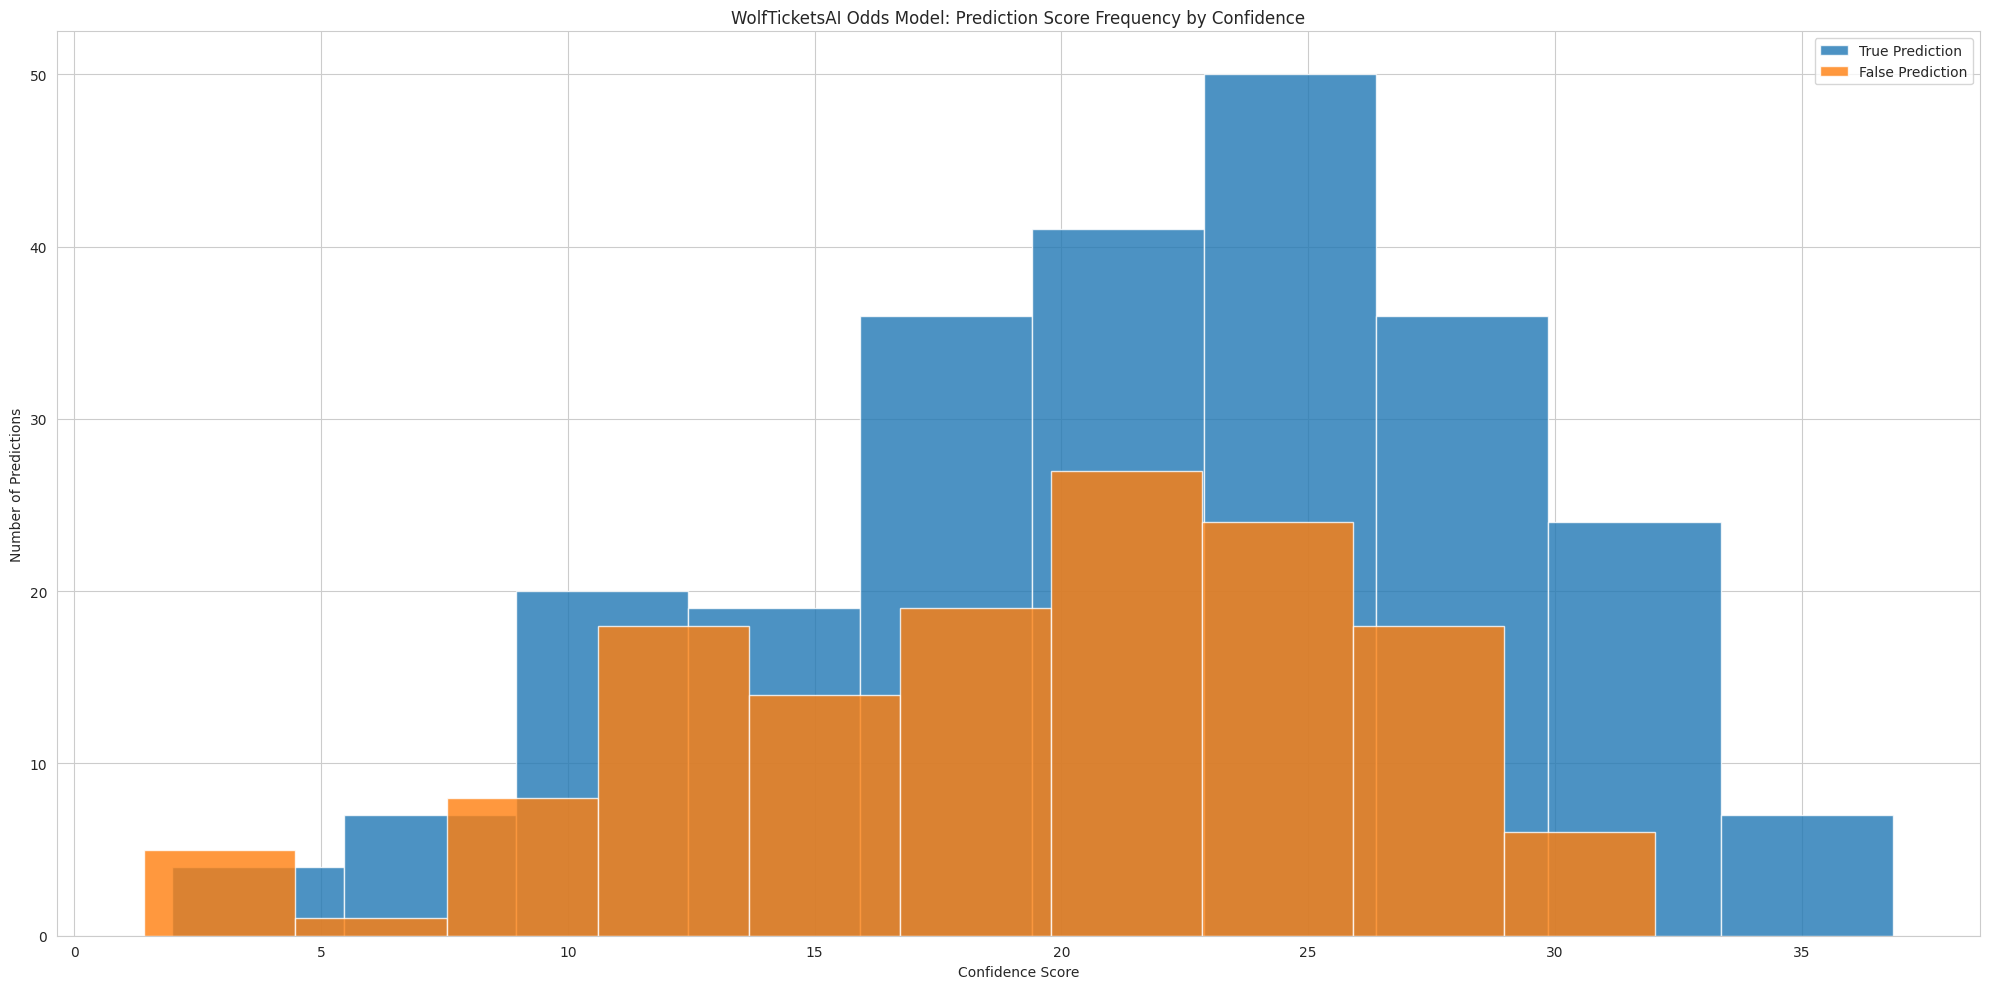
Our confidence tier analysis shows the model’s exceptional performance on high-confidence predictions, with 91.7% accuracy when the model is very confident (>80% probability).
Results
Testing this methodology on historical data produced signficant improvements:
| Metric | Traditional Method | Empirical EV | Improvement |
|---|---|---|---|
| ROI | 151.1% | 212.2% | +61.1pp |
| Win Rate | 40.0% | 57.6% | +17.6pp |
| Sharpe Ratio | 0.136 | 0.261 | +92% |
| Max Drawdown | -23.0% | -18.7% | Better |
| Volatility | $158 | $123 | -22% |
More importantly, the empirical method is more selective 7 7 This selectivity is a feature, not a bug. By identifying fewer but higher-quality opportunities, we reduce the impact of betting market efficiency on marginal value bets while concentrating capital on our strongest edges. This also explains why there are less overall bets on our first plot. - identifying positive EV opportunities in 46.2% of fights versus 74.1% with the traditional approach. Quality over quantity.

The empirical approach finds fewer but higher-quality betting opportunities, leading to more consistent profits with lower variance.
This Week’s Predictions: UFC 08/23/2025
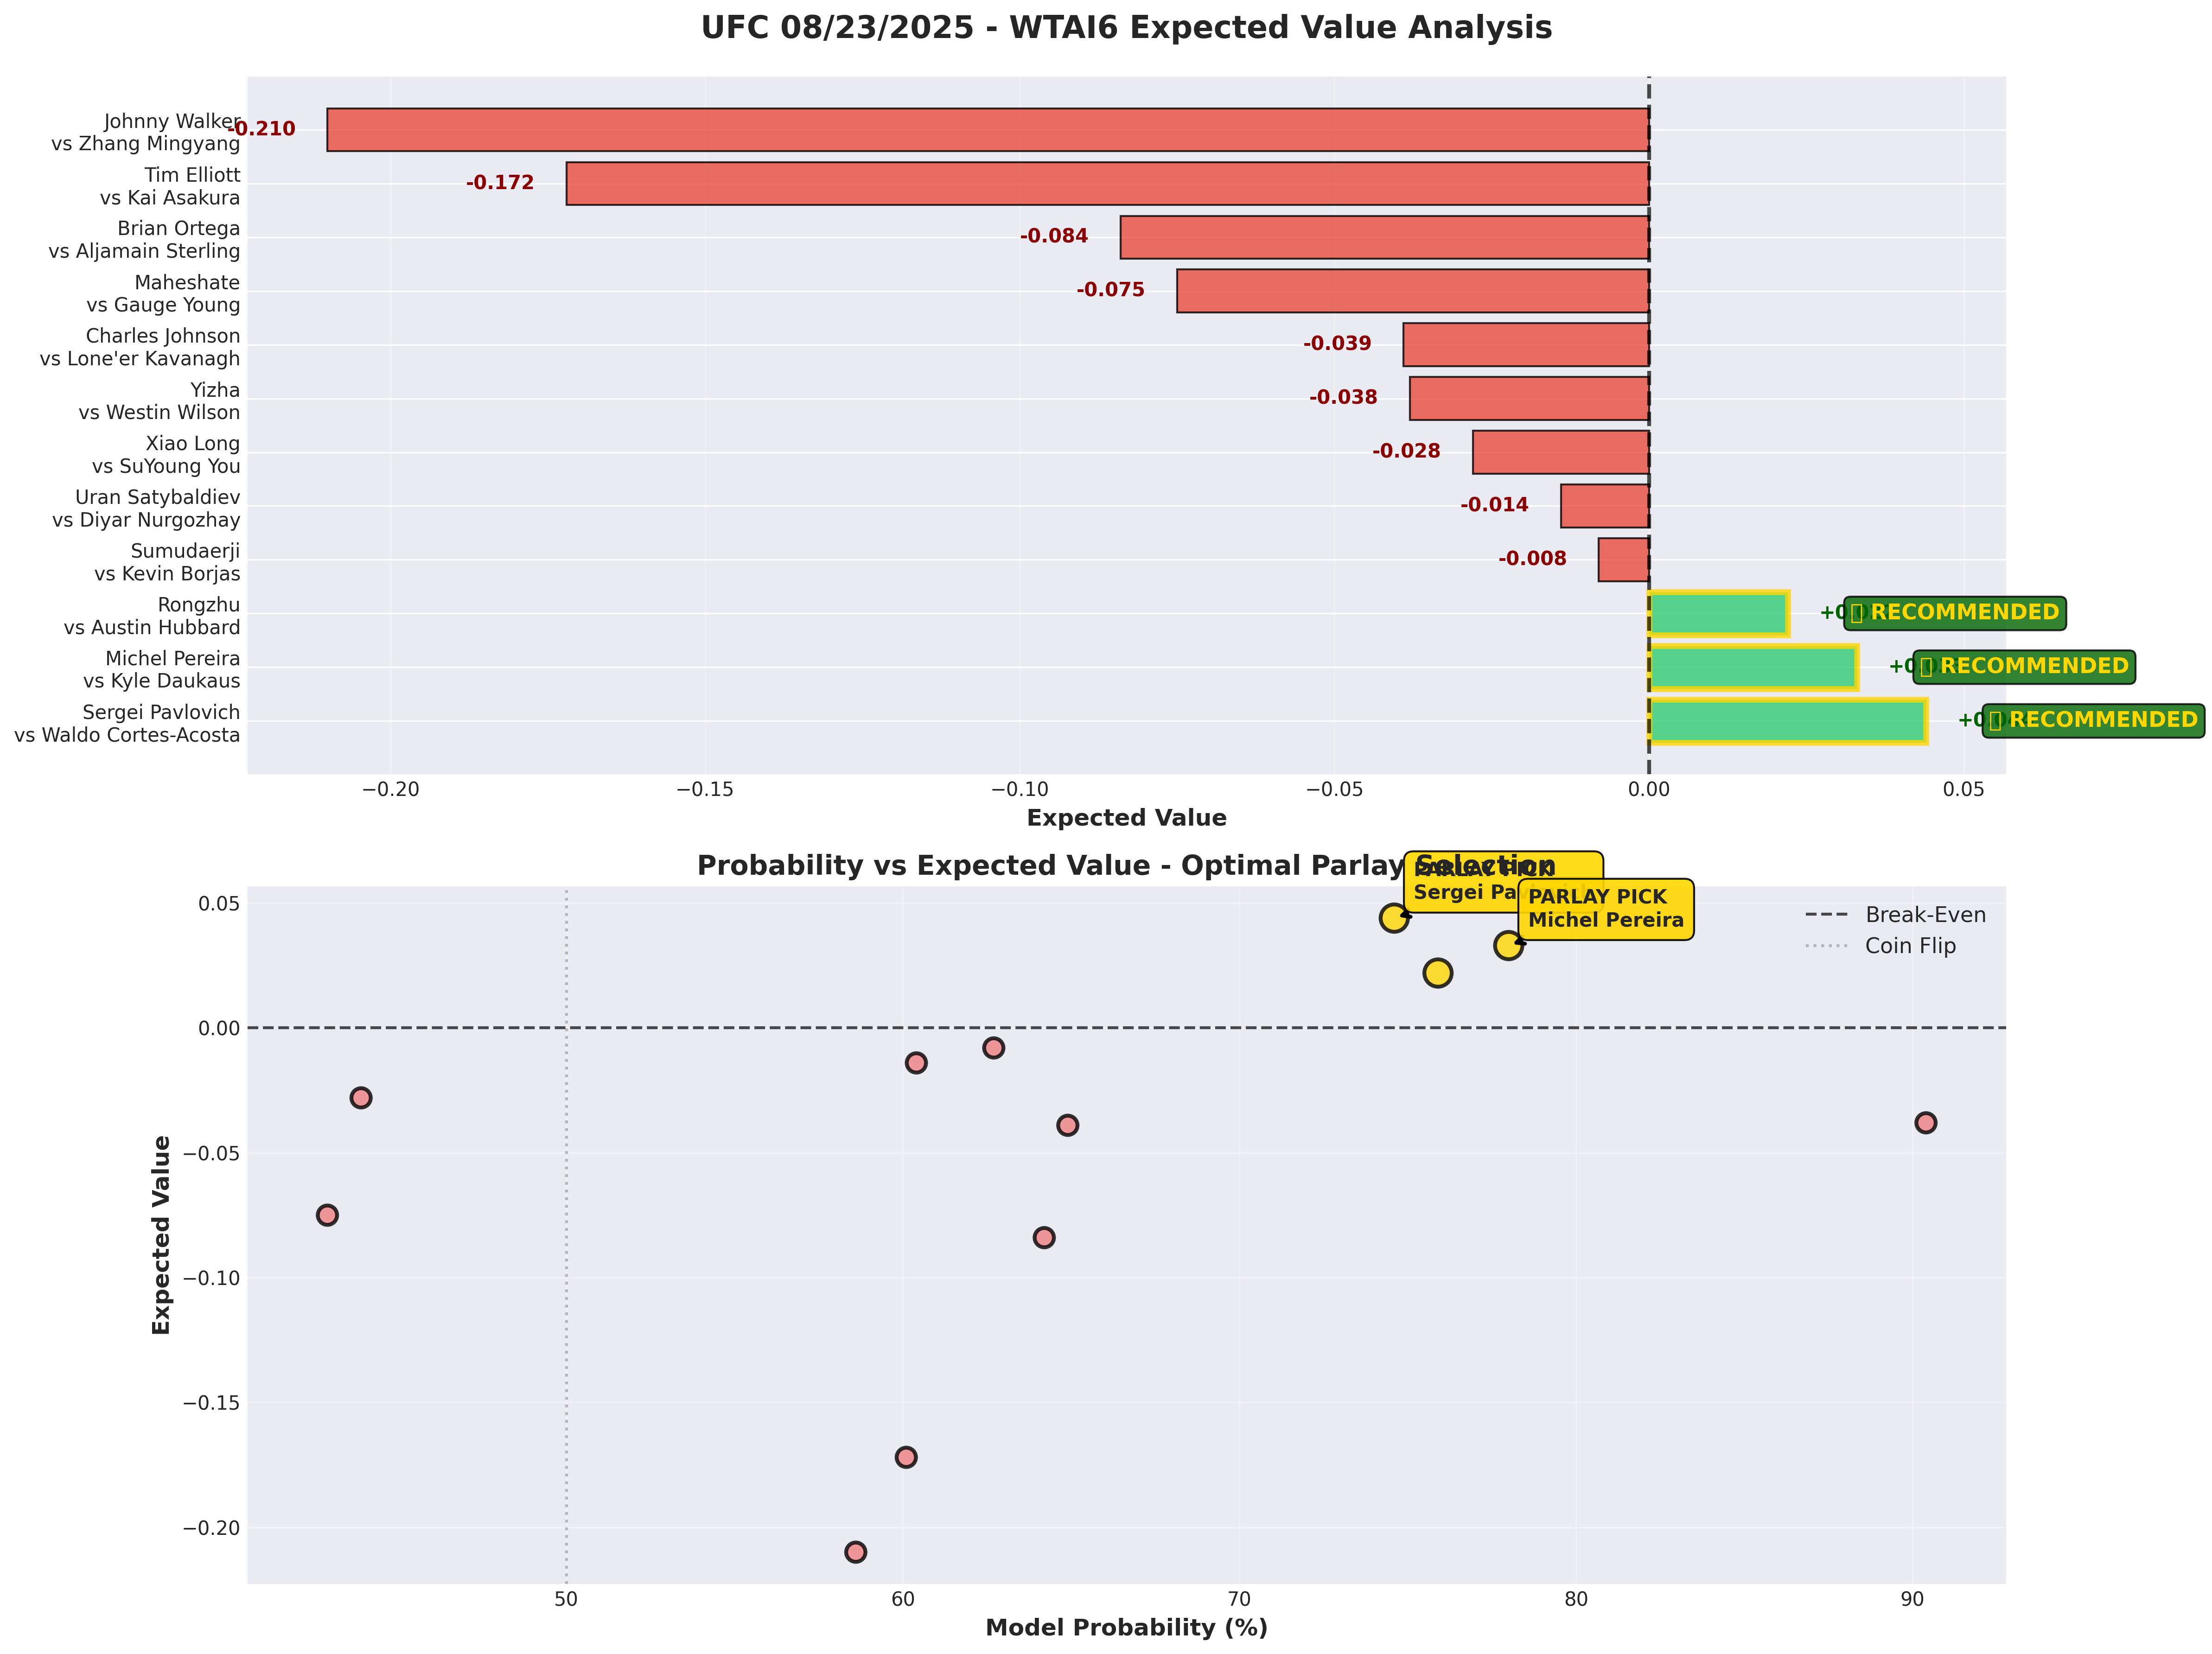
I put WTAI6 to work on this weekend’s card. After analyzing all 12 fights, there are 3 positive EV opportunities (25% hit rate - healthy for a sharp market):
RECOMMENDED PARLAY
Sergei Pavlovich (-235) + Michel Pereira (-295)
- Combined Expected Value: +0.077 (7.7% edge)
- Estimated Win Probability: 58.2%
- Parlay Odds: -110
- $100 Bet Returns: $190.88
Individual Analysis
Fight 1: Sergei Pavlovich vs Waldo Cortes-Acosta (Heavyweight)
- WTAI6 Prediction: Pavlovich wins (74.6% calibrated probability)
- Market Implied: 70.1%
- Empirical EV: +0.044
Fight 2: Michel Pereira vs Kyle Daukaus (Middleweight)
- WTAI6 Prediction: Pereira wins (78.0% calibrated probability)
- Market Implied: 74.7%
- Empirical EV: +0.033
The Math Behind the Parlay
- Break-even requirement: 52.4%
- Our estimated probability: 58.2%
Based on our historical 57.6% parlay win rate using this methodology, this represents a statistically sound betting opportunity.
Conclusion:
For this weekend’s UFC 08/23/2025 card, I’m backing our analysis with the Pavlovich + Pereira parlay. It’s a measured bet with solid mathematical foundation. exactly the kind of opportunity WTAI6 was designed to identify.
As always, bet responsibly and within your means. Past performance doesn’t guarantee future results, but WTAI6 gives us the best probabilistic edge we’ve ever achieved.
Thank you for all the support and I can’t want to get this system embeded into the WolfTicketsAI site over the next month(the codebase is nearly 6 years old at this point)!
Good Luck!
Footnotes
- ↩ The Ensemble approach combines multiple base learners (Random Forest, XGBoost, LightGBM, Neural Networks) with stacking.
- ↩ This is really just proof that Light Heavyweight is the worst possible weight class. Take that as you wish.
- ↩ Traditional confidence mapping typically uses a linear or simple polynomial relationship between raw model scores and assigned confidence percentages, without validation against historical performance. This approach assumes the model’s internal confidence scoring aligns with real-world accuracy, which is rarely the case in practice.
- ↩ Empirical Expected Value differs from theoretical EV by using actual historical model performance to calibrate probabilities rather than relying on the model’s raw confidence scores. This approach ensures that when we assign a 75% win probability, fighters actually win approximately 75% of the time historically.
- ↩ The scipy.interpolate module provides robust interpolation methods for creating smooth calibration functions. We use monotonic cubic spline interpolation to ensure the calibration function maintains logical probability ordering while smoothing over noise in smaller probability bins.
- ↩ Model underconfidence at high probability ranges is common in machine learning applications where base rates are considered. The model correctly identifies strong signals but doesn’t account for the compounding effect of multiple positive indicators, leading to systematically conservative probability estimates.
- ↩ This selectivity is a feature, not a bug. By identifying fewer but higher-quality opportunities, we reduce the impact of betting market efficiency on marginal value bets while concentrating capital on our strongest edges. This also explains why there are less overall bets on our first plot.
